Data preparation#
In this tutorial, we introduce how to use EpiPack together with external preprocessing tools to generate the peak embedding and gene score matrix required for building a mappable reference model with PEIVI and for subsequent query mapping. We will use the 10X Genomics PBMC dataset as an example.
[1]:
## load epipack package

# !pip install --upgrade epipackpy
import scanpy as sc
import numpy as np
import pandas as pd

import epipackpy as epk
print(epk.__version__)
1.0.1dev4
1. Create gene score matrix#
To construct the gene score matrix, we recommend using either snapATAC2 or Signac, both of which provide efficient and flexible workflows for generating gene activity scores from scATAC-seq data. While ArchR can also be used for this purpose, its flexibility is somewhat lower compared to snapATAC2 and Signac.
To download the original data that we use in this page, please use wget and get the data from 10x Genomics Dataset 5k PBMC to apply the data preparation steps. Normally, EpiPack package needs (1) peak matrix (2) fragments.tsv and .tbi.
Signac#
We put the R code for quality control and gene activity score generation as below, more details can be found on their website.
[ ]:
library(Signac)
library(Seurat)
library(GenomeInfoDb)
library(EnsDb.Hsapiens.v86)

counts <- Read10X_h5(filename = "atac_pbmc_5k_nextgem_filtered_peak_bc_matrix.h5")
metadata <- read.csv(
  file = "atac_pbmc_5k_nextgem_singlecell.csv",
  header = TRUE,
  row.names = 1
)

chrom_assay <- CreateChromatinAssay(
  counts = counts,
  sep = c(":", "-"),
  genome = 'hg38',
  fragments = 'atac_pbmc_5k_nextgem_fragments.tsv.gz',
  min.cells = 10,
  min.features = 200
)

pbmc <- CreateSeuratObject(
  counts = chrom_assay,
  assay = "peaks",
  meta.data = metadata
)


annotations <- GetGRangesFromEnsDb(ensdb = EnsDb.Hsapiens.v86)
seqlevelsStyle(annotations) <- 'UCSC'
Annotation(pbmc) <- annotations

gene.activities <- GeneActivity(pbmc)
write.csv(t(gene.activities),file = "pbmc_10k_geneactivity.csv", row.names = T, col.names = T)
The genescore.csv file can be loaded by pd.read_csv in Python.
snapATAC2#
[2]:
import snapatac2 as snap
print(snap.__version__)
2.7.1
[ ]:
data = snap.pp.import_data(
    "/data/pbmc_batch/pbmc_5k_nextgem/atac_pbmc_5k_nextgem_fragments.tsv.gz",
    chrom_sizes=snap.genome.hg38,
    file="PBMC.h5ad",  # Optional
    sorted_by_barcode=False,
)
snap.metrics.tsse(data, snap.genome.hg38)
snap.pl.tsse(data, interactive=False)
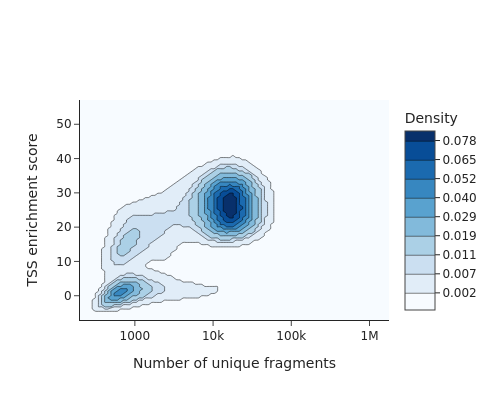
[4]:
snap.pp.filter_cells(data, min_tsse=10, min_counts=5000)
gene_matrix = snap.pp.make_gene_matrix(data, snap.genome.hg38)
gene_matrix
/nethome/ycheng430/miniconda3/envs/epipack/lib/python3.9/site-packages/anndata/_core/anndata.py:121: ImplicitModificationWarning:

Transforming to str index.
[4]:
AnnData object with n_obs × n_vars = 4565 × 60606
    obs: 'n_fragment', 'frac_dup', 'frac_mito', 'tsse'
2. Create peak embedding#
After obtaining the gene score matrix, the next step is to generate the peak embeddings using the epipack toolkit.
First, we need to load the peak file (e.g., the BED file containing peak regions) and ensure that the cells are aligned based on the quality control results from either snapATAC2 or Signac. This alignment guarantees that the peaks and cell barcodes used for embedding are consistent with those used in the gene score matrix.
[ ]:
peak_1 = epk.dt.read_10x_h5("data/pbmc_batch/pbmc_5k_nextgem/atac_pbmc_5k_nextgem_filtered_peak_bc_matrix.h5")
peak_1
AnnData object with n_obs × n_vars = 4623 × 135377
    var: 'gene_ids', 'feature_types', 'genome'
[ ]:
###align cells between genescore and peak file

common_cells = gene_matrix.obs_names.intersection(peak_1.obs_names)
peak_1= peak_1[common_cells, :]
gene_matrix = gene_matrix[common_cells,:]
After that, EpiPack peak encoder can be used to generate peak embedding. All peaks should be converted to 0-1 binary format.
[18]:
peak_1 = epk.dt.make_binary(peak_1)
Before training the binary autoencoder, we follow the same peak filtering process as PeakVI to filter out rarely detected peaks, to make the training faster.
[19]:
print("# regions before filtering:", peak_1.shape[-1])

# compute the threshold: 5% of the cells
min_cells = int(peak_1.shape[0] * 0.05)
# in-place filtering of regions
sc.pp.filter_genes(peak_1, min_cells=min_cells)

print("# regions after filtering:", peak_1.shape[-1])
# regions before filtering: 135377
# regions after filtering: 38749
Model training#
we will start training the binary autoencoder model to obtain batch-specific latent embedding. If the peak matrix is in dense matrix format, we need to input anndata.X.todense() to the model.
[20]:
# model initialization
pretrain_peak_model = epk.ml.Peak_Model(count_enhancer=peak_1.X.todense())

# model training
pretrain_peak_model.train_model(nepochs=150)
- Model initializing...
- [Auto-detection]: GPU detetced. Model will be initialized in GPU mode.
- Model intialization completed.
Epochs: 100%|██████████| 150/150 [02:36<00:00, 1.04s/it, loss_val=9.55e+3]
get the peak embedding#
We can extract the latent embedding and save it to the h5ad file. For the other peak files, repeat the process and save the integrated gene score matrix into one h5ad file.
[22]:
peak_1.obsm['Z_epipack'] = pretrain_peak_model.get_z().detach().numpy()
[ ]:
peak_1.write_h5ad("EDIT_YOUR_PATH")
gene_matrix.write_h5ad("EDIT_YOUR_PATH")